Graph
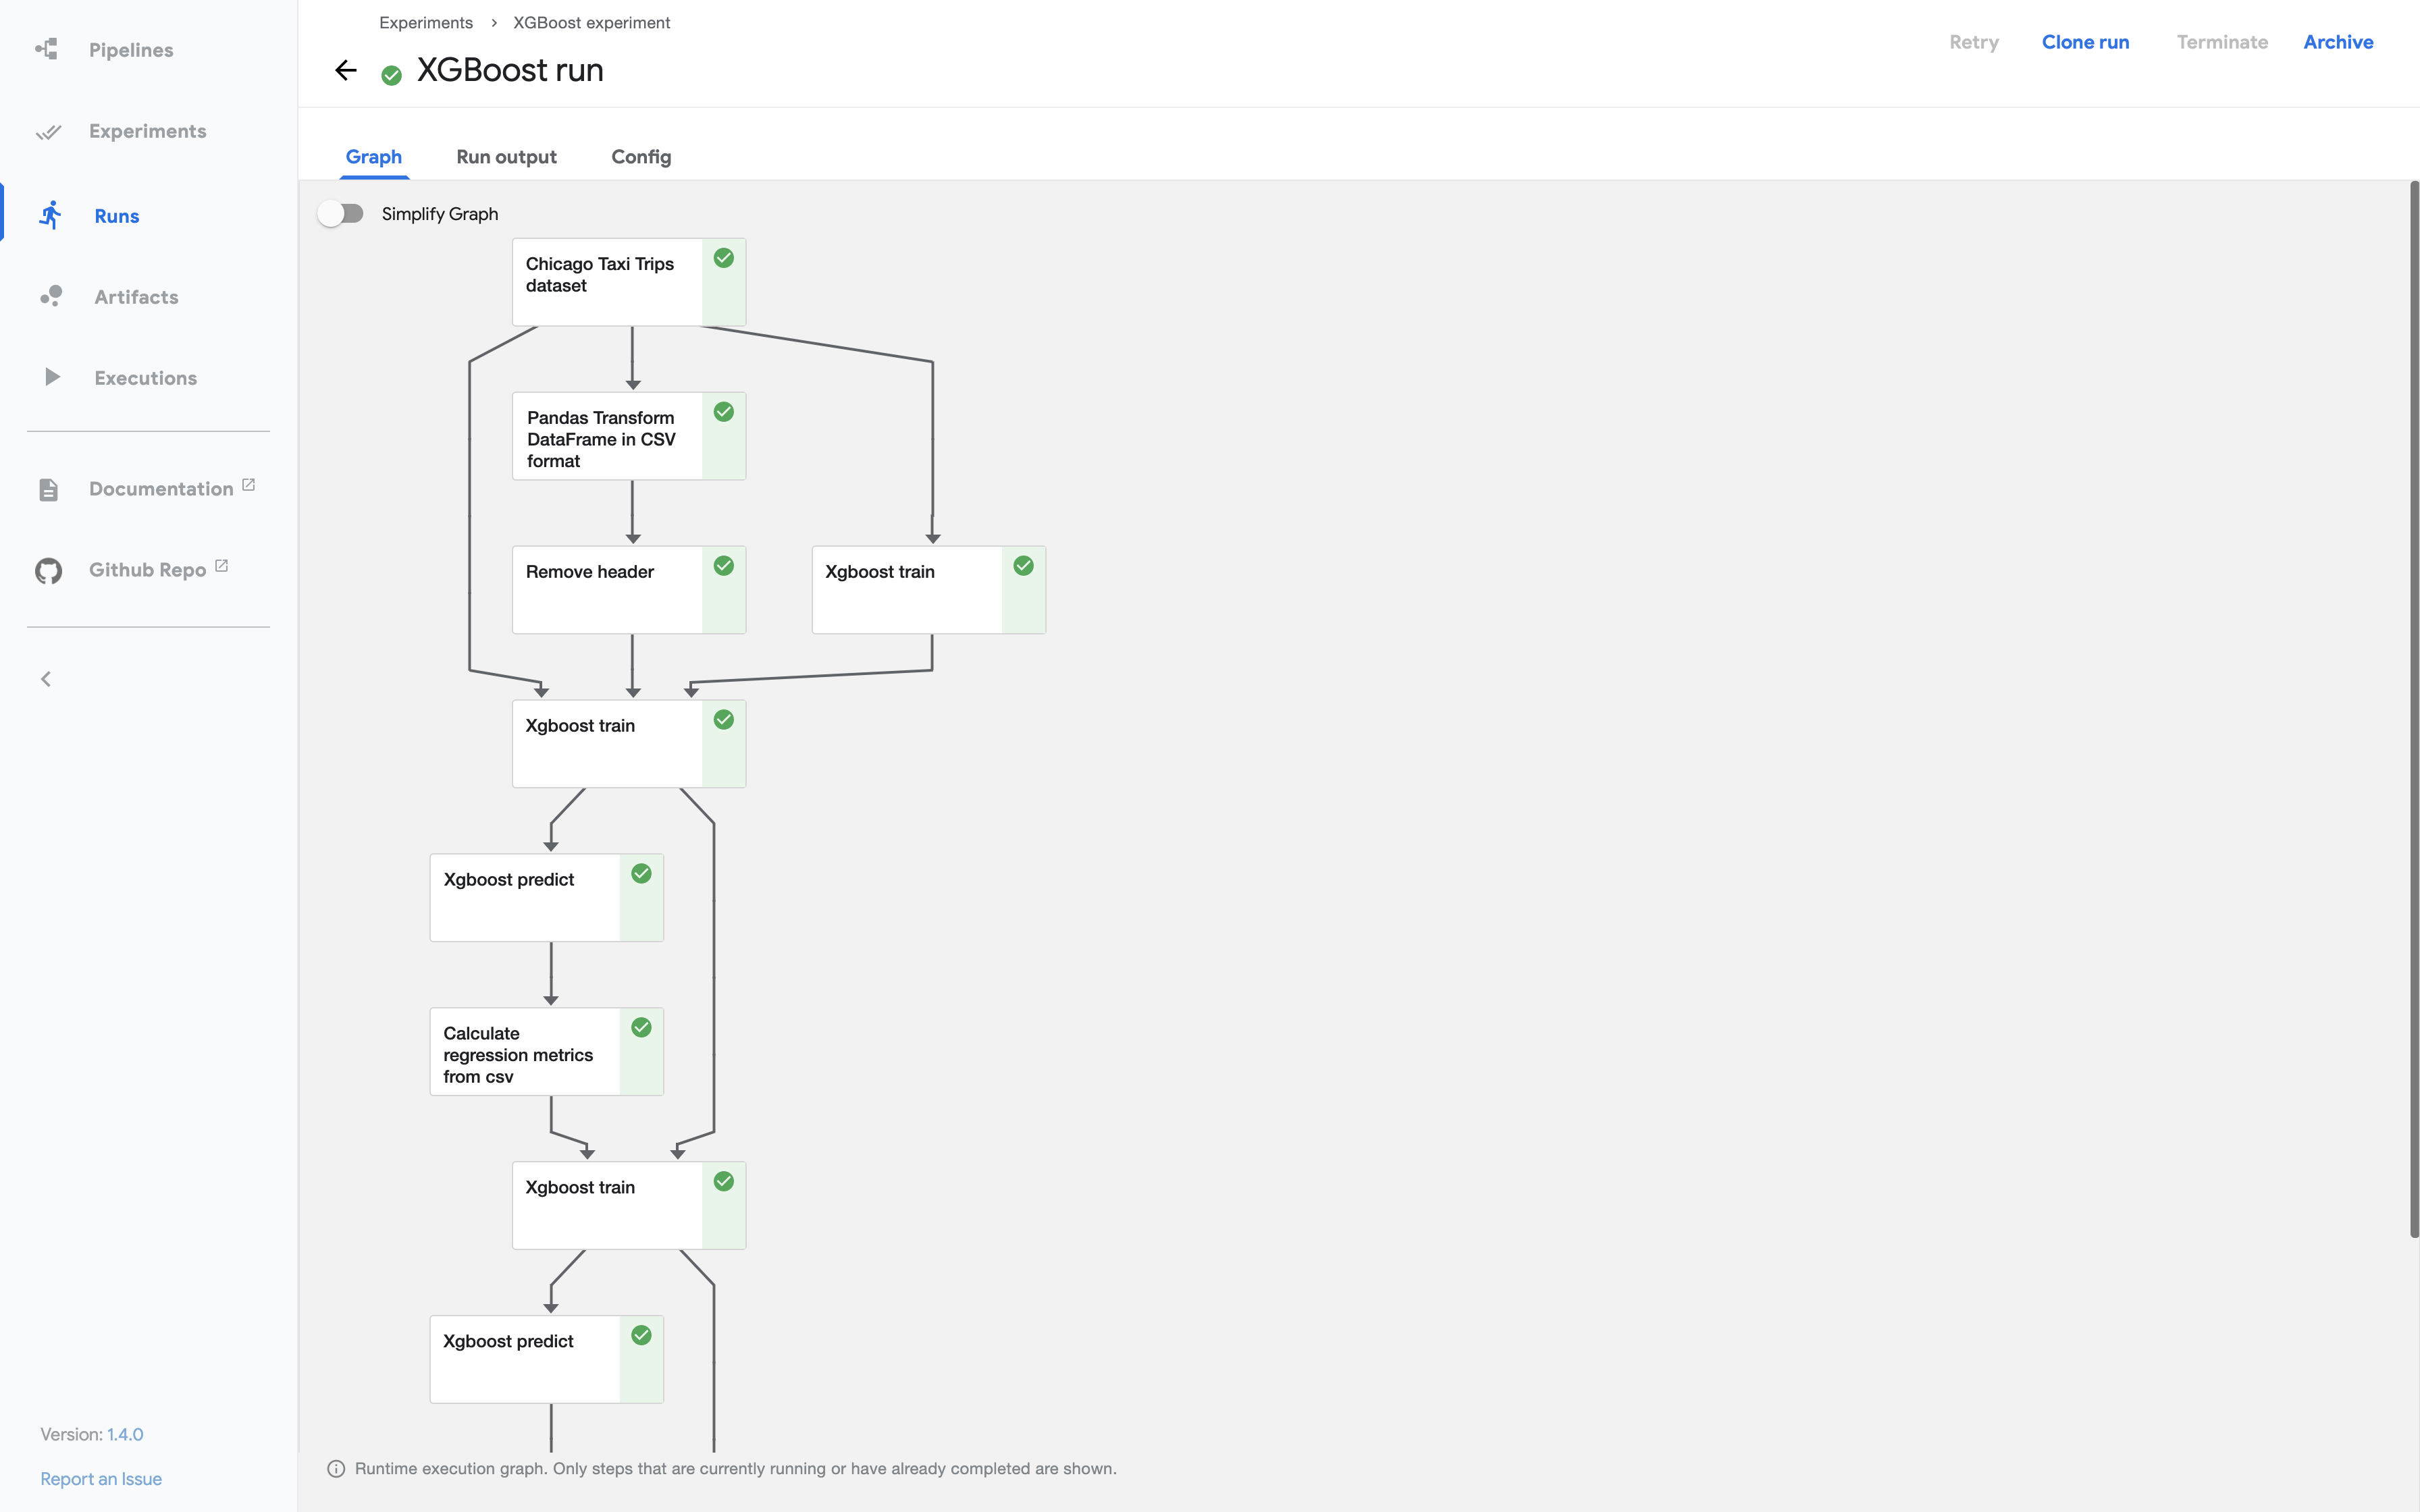
A graph is a pictorial representation in the Kubeflow Pipelines UI of the runtime execution of a pipeline. The graph shows the steps that a pipeline run has executed or is executing, with arrows indicating the parent/child relationships between the pipeline components represented by each step. The graph is viewable as soon as the run begins. Each node within the graph corresponds to a step within the pipeline and is labeled accordingly.
The screenshot below shows an example of a pipeline graph:

At the top right of each node is an icon indicating its status: running, succeeded, failed, or skipped. (A node can be skipped when its parent contains a conditional clause.)
Next steps
- Read an overview of Kubeflow Pipelines.
- Follow the pipelines quickstart guide to deploy Kubeflow and run a sample pipeline directly from the Kubeflow Pipelines UI.
Feedback
Was this page helpful?
Glad to hear it! Please tell us how we can improve.
Sorry to hear that. Please tell us how we can improve.