Comparing Pipeline Runs
Prerequisites
To compare pipeline runs, you need to first have at least two pipeline runs of the same version! You can run your first pipeline by following the pipelines quickstart guide.
This page will show the v2 UI, which allows you to compare the following visualization types:
- Scalar Metrics
- Confusion Matrices
- ROC Curves
- HTML
- Markdown
Basic Layout
The KFPv2 Run Comparison page has three major sections:
- Run overview
- Parameters
- Metrics
KFPv2 Run Comparison Full Page
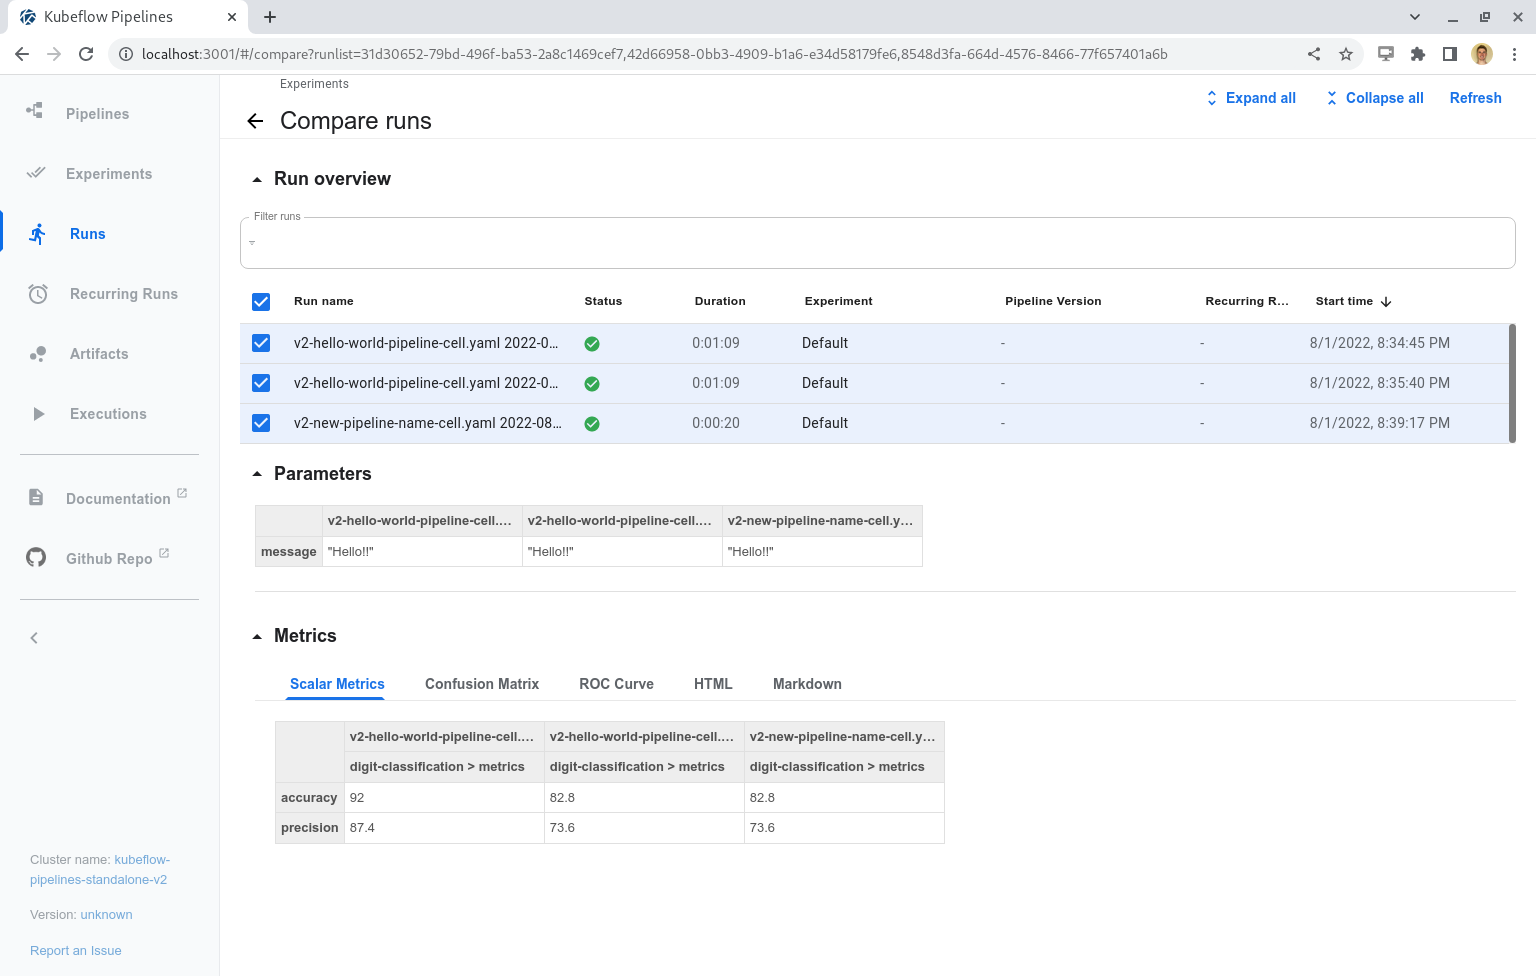
The Run overview section allows the user to view and select specific runs. Any changes to these selections will automatically update the Parameters and Metrics sections accordingly. The “Refresh” button at the top-right of the page will re-fetch the runs, and display any new run status or artifact information on the page. In order to best use this page, we recommend that run names are reasonably differentiated, preferably at the start of the run name.
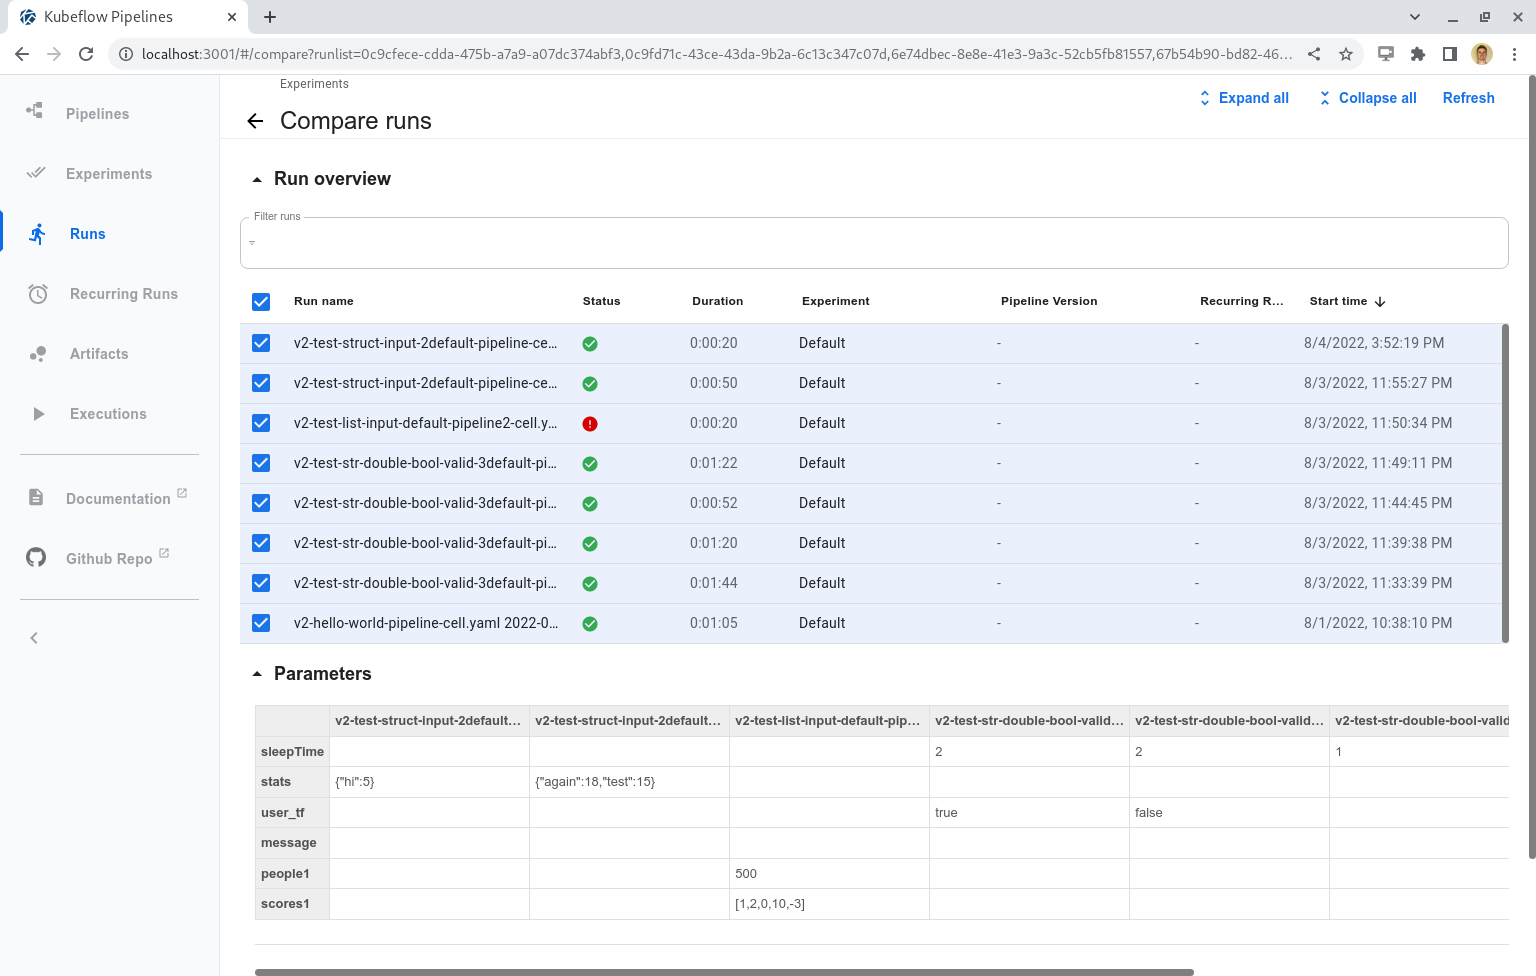
The Parameters section consists of a table that shows the run parameters for each run, even if a run has no parameters. These parameters are only shown if they are explicitely included in the pipeline run (default parameters are not present). The new KFPv2 update allows different parameter types (Double, Integer, String, Boolean, List, and Struct), and the format of the display allows users to differentiate these data types.
Run Parameters Compare Table
The Metrics section has five different tabs, one for each visualization type. The below sections will review each of these tabs.
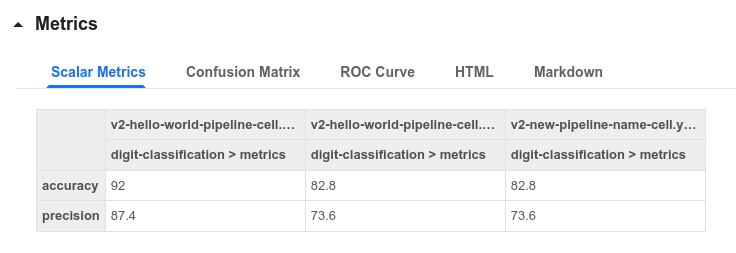
Scalar Metrics
The Scalar Metrics tab compares scalar metrics across runs in table form. The top row of this table
groups the executions and artifacts into their runs. The second row shows each artifact via the
format <execution-name>-<artifact-name>, which allows each artifact to be uniquely differentiated.
If a run is not present, then that means it did not have any scalar metrics artifacts. The data is
then presented in the rows below.
Note: In the case that an execution or artifact name cannot be found, it will display its corresponding ID as a placeholder.
Scalar Metrics Compare Table
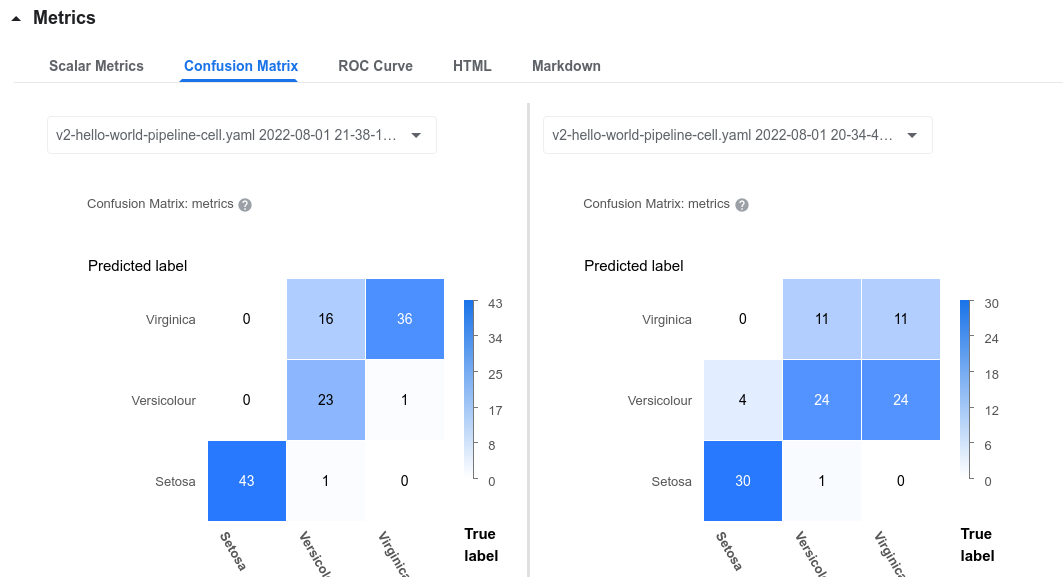
Confusion Matrix, HTML, and Markdown
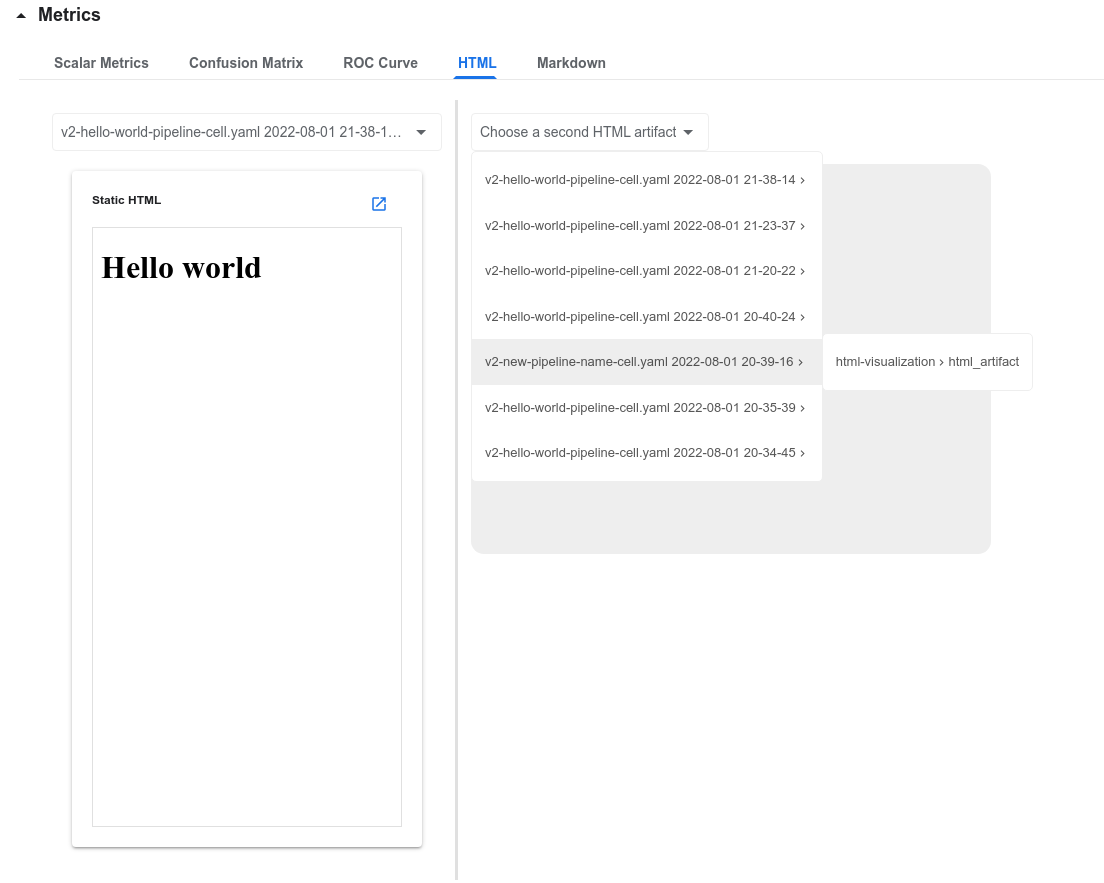
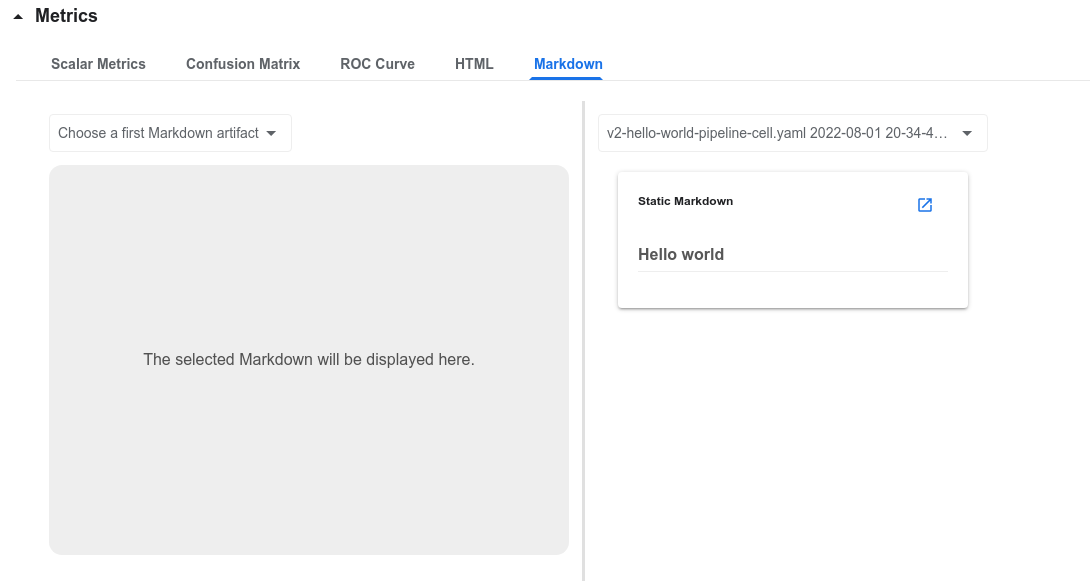
The display for comparing Confusion Matrices, HTML, and Markdown all use a two-panel layout
to compare the data side-by-side. A specific artifact can be selected via the two-level dropdown;
the first level shows the list of runs with the specified artifact, and the second level shows
the list of selectable artifacts with the naming schema <execution-name>-<artifact-name>.
This dropdown is visible on the HTML tab below.
Confusion Matrix Comparison
HTML Comparison
Markdown Comparison
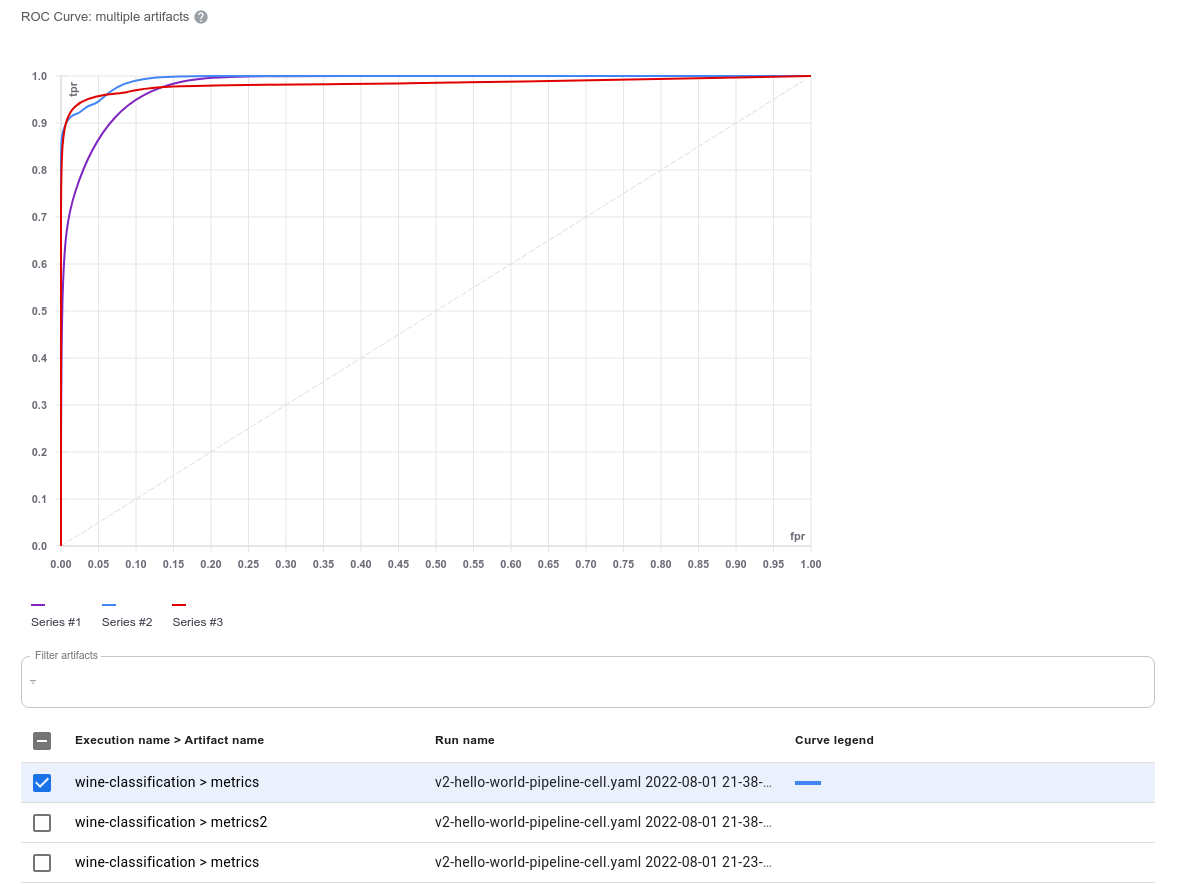
ROC Curve
The ROC Curve tab consists of two major components: an ROC Curve plot which displays all of the selected artifacts, and the filter table which allows users to search for and select artifacts. The plot limits selection up to 10 curves, after which you must de-select artifacts in order to select more.
The user can hover over any “Series” item in the plot legend in order to highlight the curve; since many curves may be identical, this will also bring the selected curve to the forefront. De-selecting and re-selecting an artifact on the filter table will also bring that curve to the top of the plot.
ROC Curve Plot
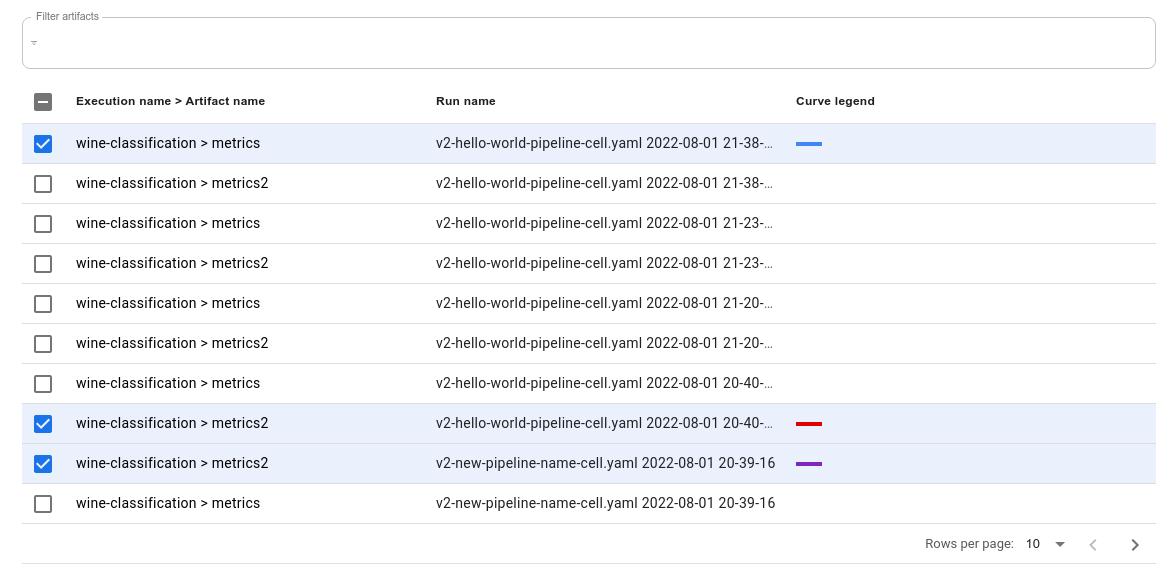
The ROC Curve filter table allows you to filter and select artifacts. The user can search by run
name or the combination of [execution-name] > [artifact-name] (which is shown on the first column).
When you select a artifact, the table will assign it a color which you can then use to identify the
Series # and the line on the plot. If you select 10 artifacts while there are more artifacts
available, a warning will pop up indicating that you have reached the maximum number of selected
artifacts, and the remaining artifact checkbox selections will be disabled; this prevents the table
from becoming too cluttered.
ROC Curve Filter Table
Conclusion
The KFPv2 Run Comparison page allows users to perform faster analysis when comparing their runs by comparing different visualization types across pipeline run artifacts.
Next Steps
- Follow the full guide to experimenting with the Kubeflow Pipelines samples.
Feedback
Was this page helpful?
Glad to hear it! Please tell us how we can improve.
Sorry to hear that. Please tell us how we can improve.